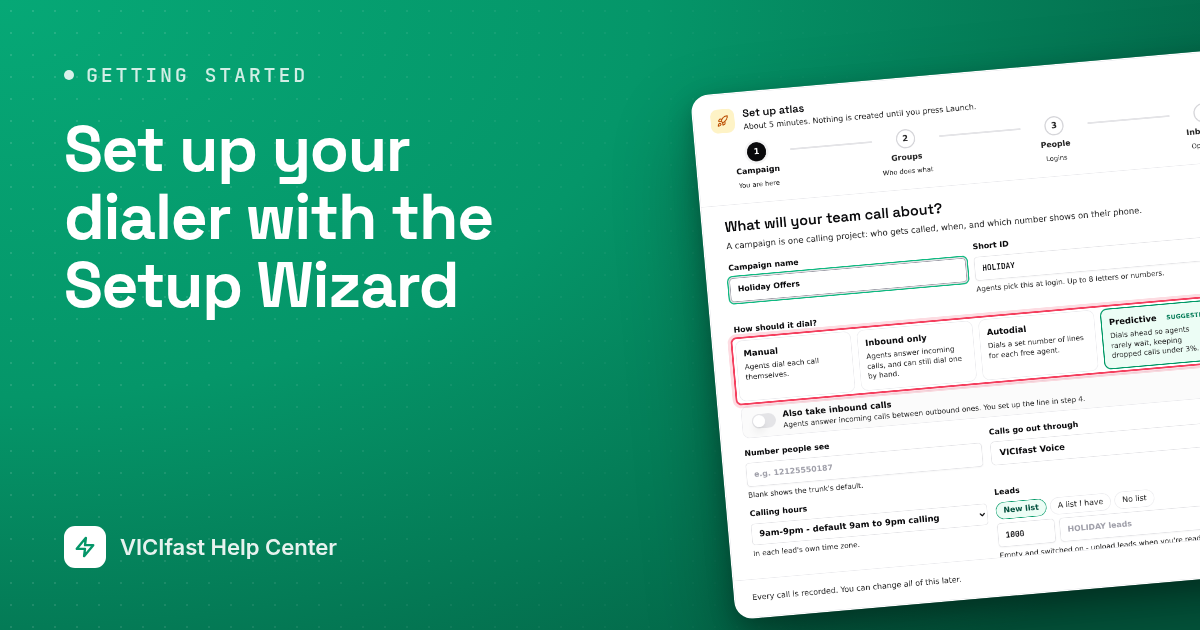
A tour of your server page
Your server page from top to bottom: the header, the tools strip, Server Health, the VICIdial logins and the tabs where daily work happens.
Getting started · 5 min read
Your server page is where you run one VICIdial server: its health, its firewall, its logins and all the daily dialer work. This tour walks the page from top to bottom so you always know where to click.
To open it, click My Servers in the sidebar, then Manage on your server's card.
The header
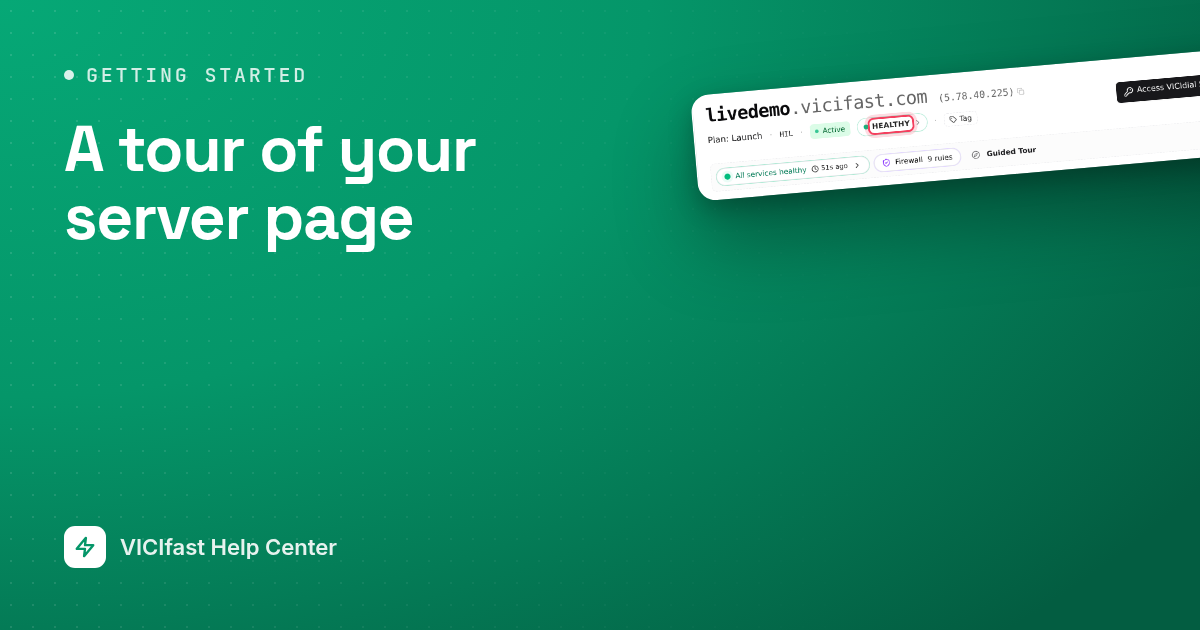
The top line is your server's address, with its IP address beside it (click the IP to copy it). Under it sits one line of facts:
- Plan: the plan this server is on.
- The region code, for example ASH.
- The status, for example Active.
- The health chip: HEALTHY, DEGRADED or UNREACHABLE. Click it to open Server Health.
- Access OK (account owner only): your address is approved and your agents are not locked out. Click it for the Access Dialer Checklist and your agent link. If it reads Agents blocked, agent logins exist but no agent has approved their address yet.
On the right:
- Access VICIdial Server opens your VICIdial logins (more below).
- SSH Access is for technical users, with options such as Manage SSH keys and Replay SSH sessions. See Root access (SSH) to your server.
- Reboot restarts the server after you confirm.
- The ⋮ menu (account owner only) holds Change / upgrade plan, Manage addons and Cancel subscription, and under Recovery, Hard reset and Factory reset.

The tools strip
The dashed strip under the header has two halves. On the left:
- The services chip: All services healthy, or how many services are up, with how long ago the server last reported. Click it to open Server Health.
- The Firewall chip: how many firewall rules you have and how many agent addresses are approved. Click it to manage who can reach your server. If it turns amber and says no agent can reach the dialer, your agents still need to approve themselves.
- Guided Tour walks you through this page one part at a time.
On the right:
- Setup Wizard (account owner): builds a campaign, groups and logins in one go. See the Setup Wizard guide.
- Migrate from ViciBox (account owner): moves an existing VICIdial server onto this one. See Move from ViciBox.
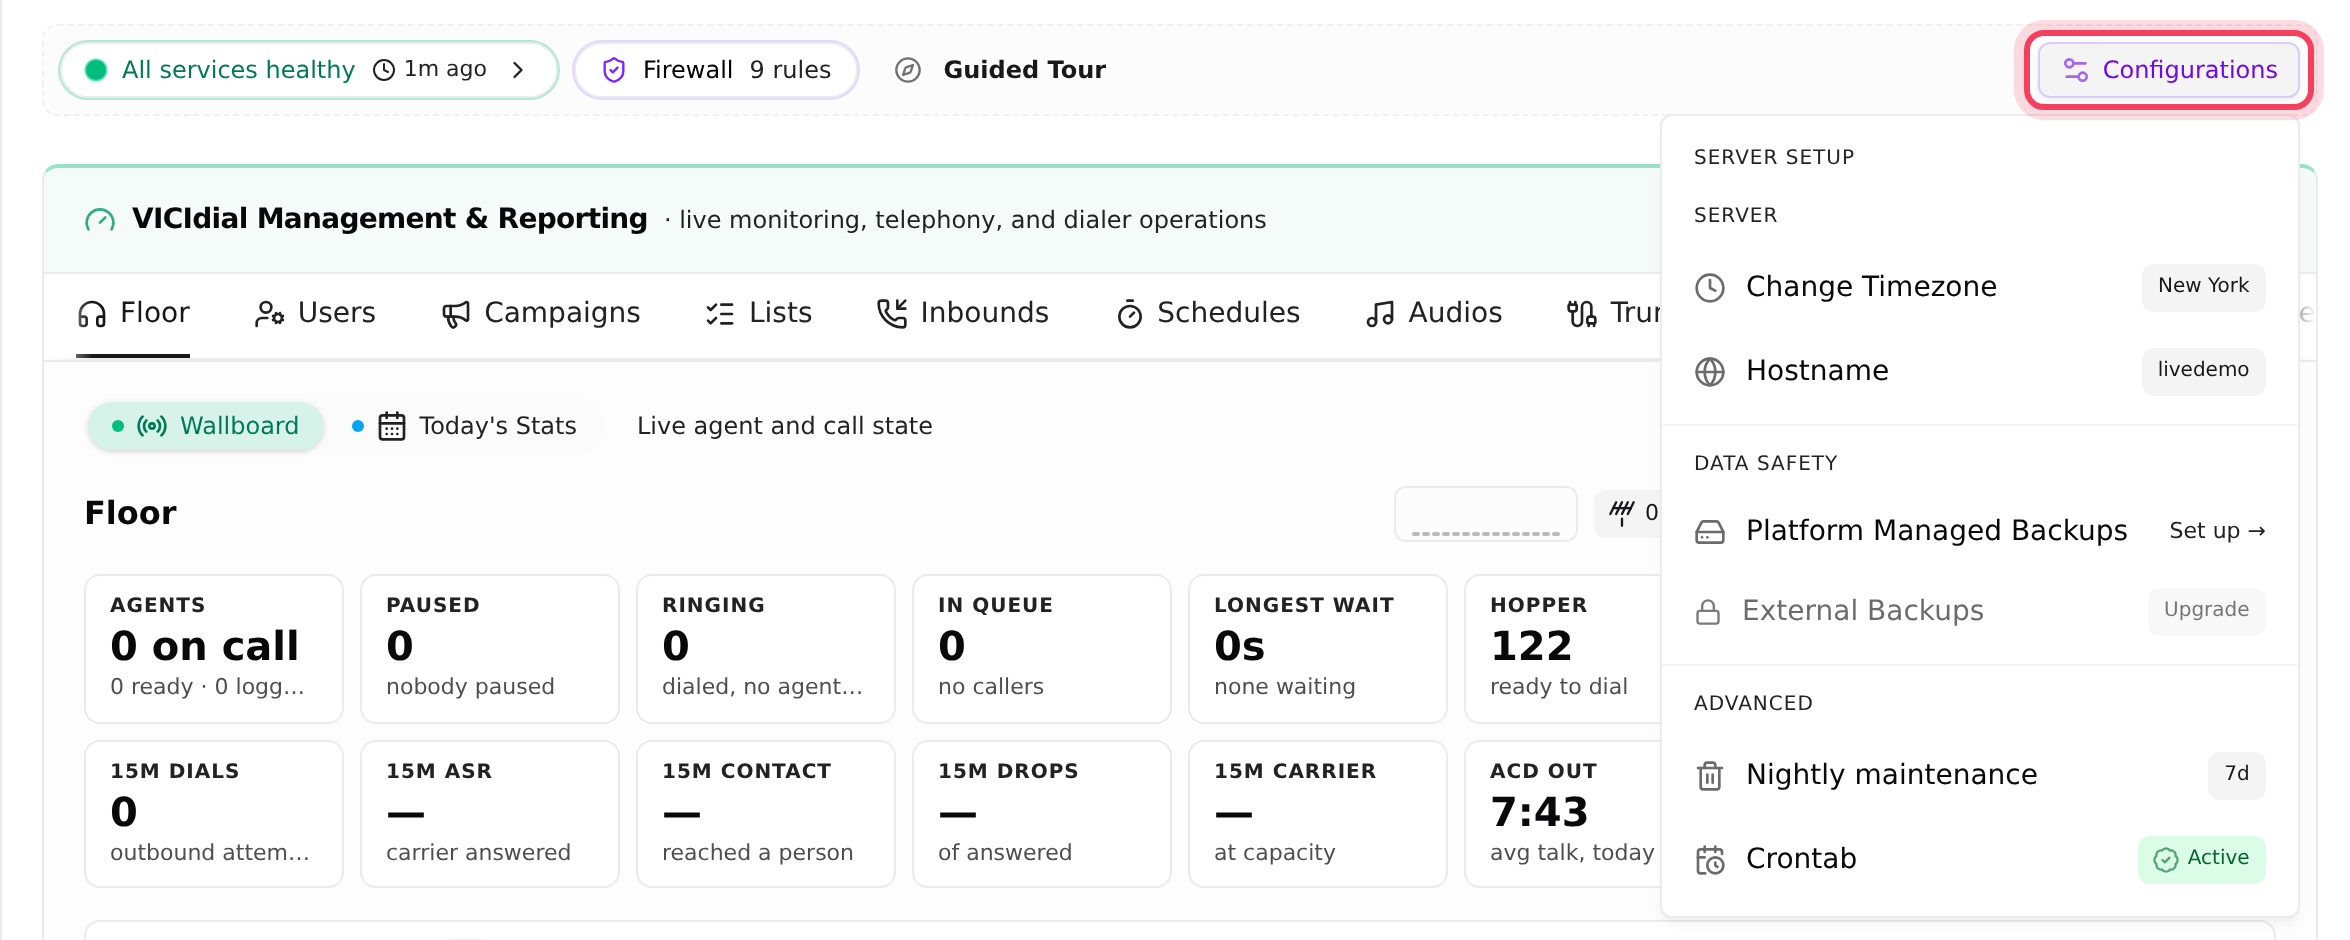
- Configurations: Change Timezone, Hostname, Platform Managed Backups, External Backups, Nightly maintenance and Crontab. Each row says Active or Set up →, or shows a lock and Upgrade when your plan doesn't include it.
Server Health
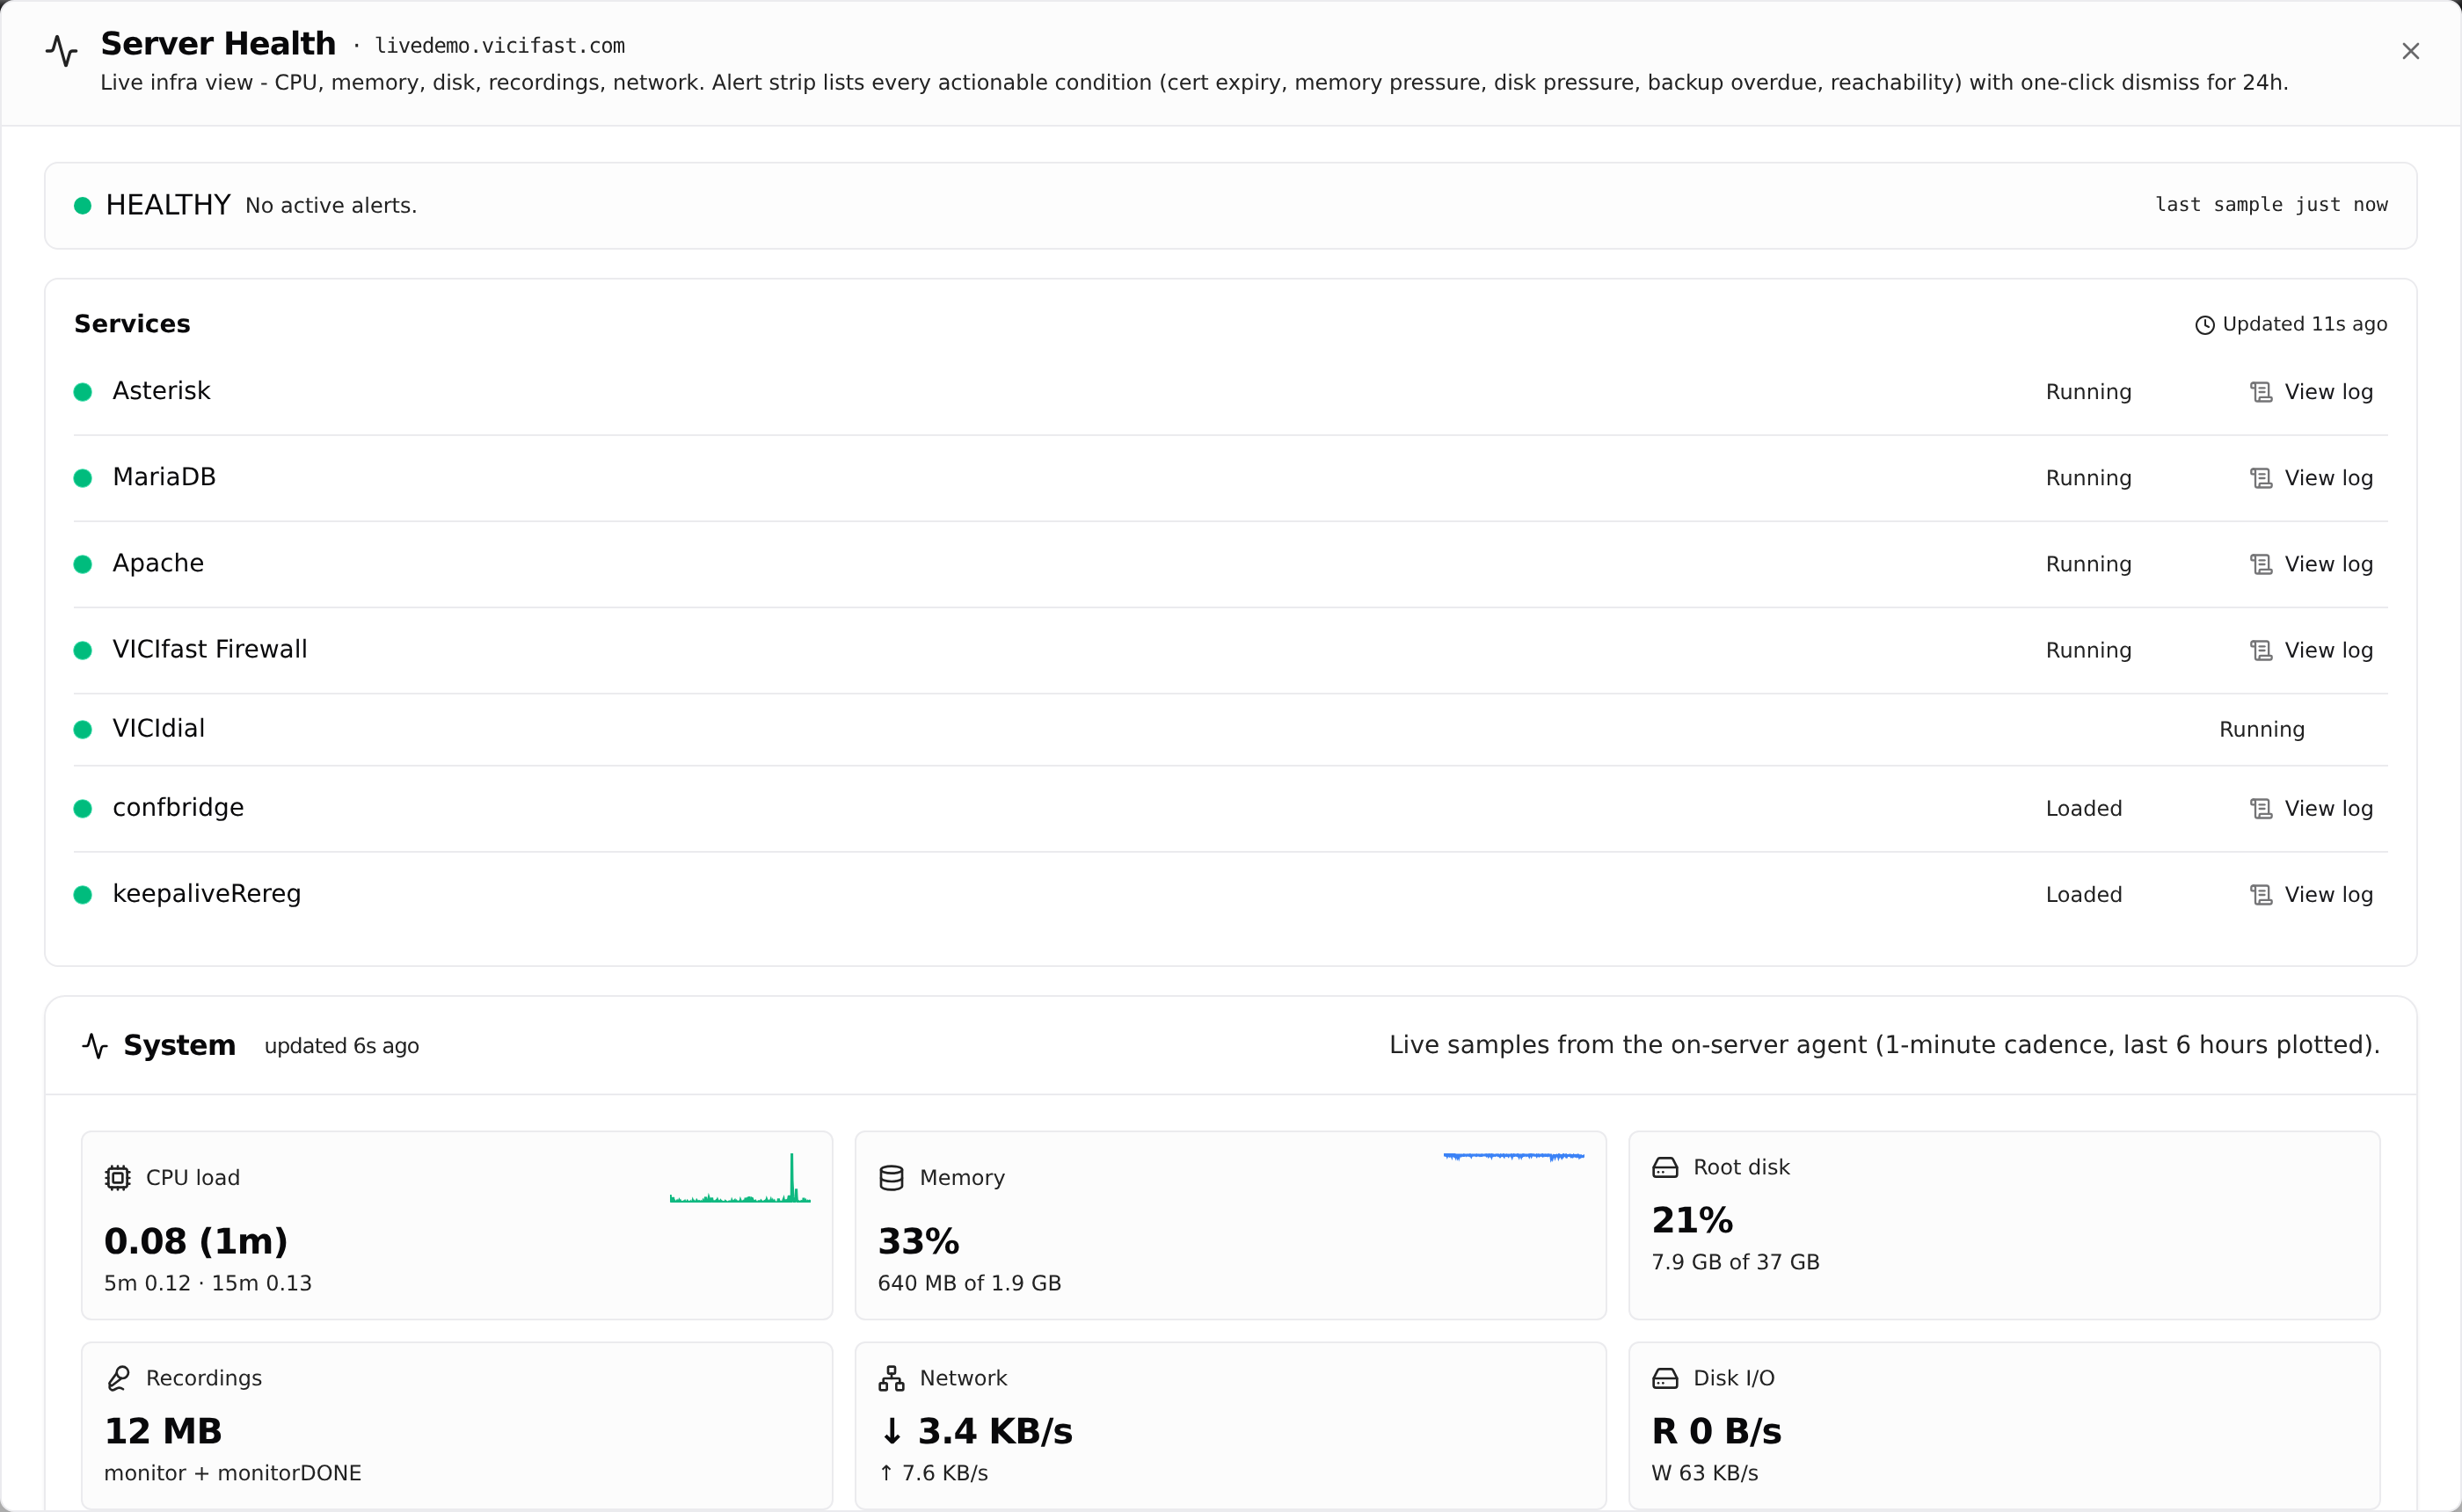
Click the health chip or the services chip to open Server Health. It shows the current status, any alerts (a certificate close to expiring, memory or disk running low, an overdue backup, the server not reachable) and charts for CPU, memory, disk, recordings and network. If your role allows it, the services list lets you read each service's log and restart it.
The most serious alerts also show as a strip on the server page itself, so you see them without opening anything.
VICIdial access
Click Access VICIdial Server to open the VICIdial access panel. Your browser remembers whether you left it open.
- Open VICIdial admin opens VICIdial's own admin screens in a new tab.
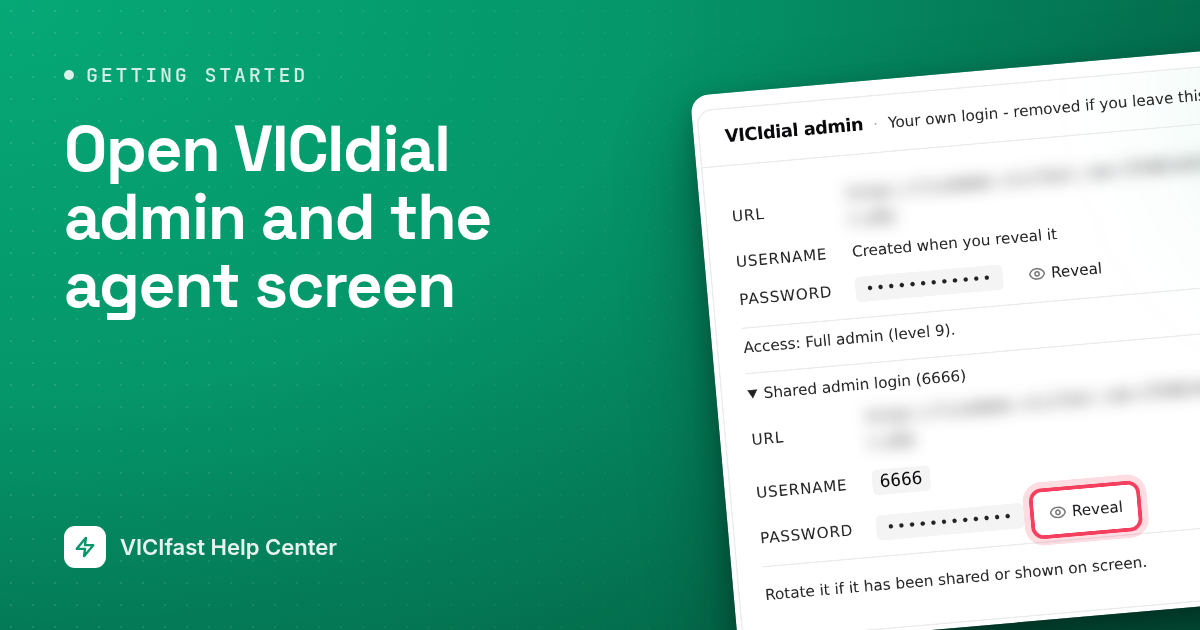
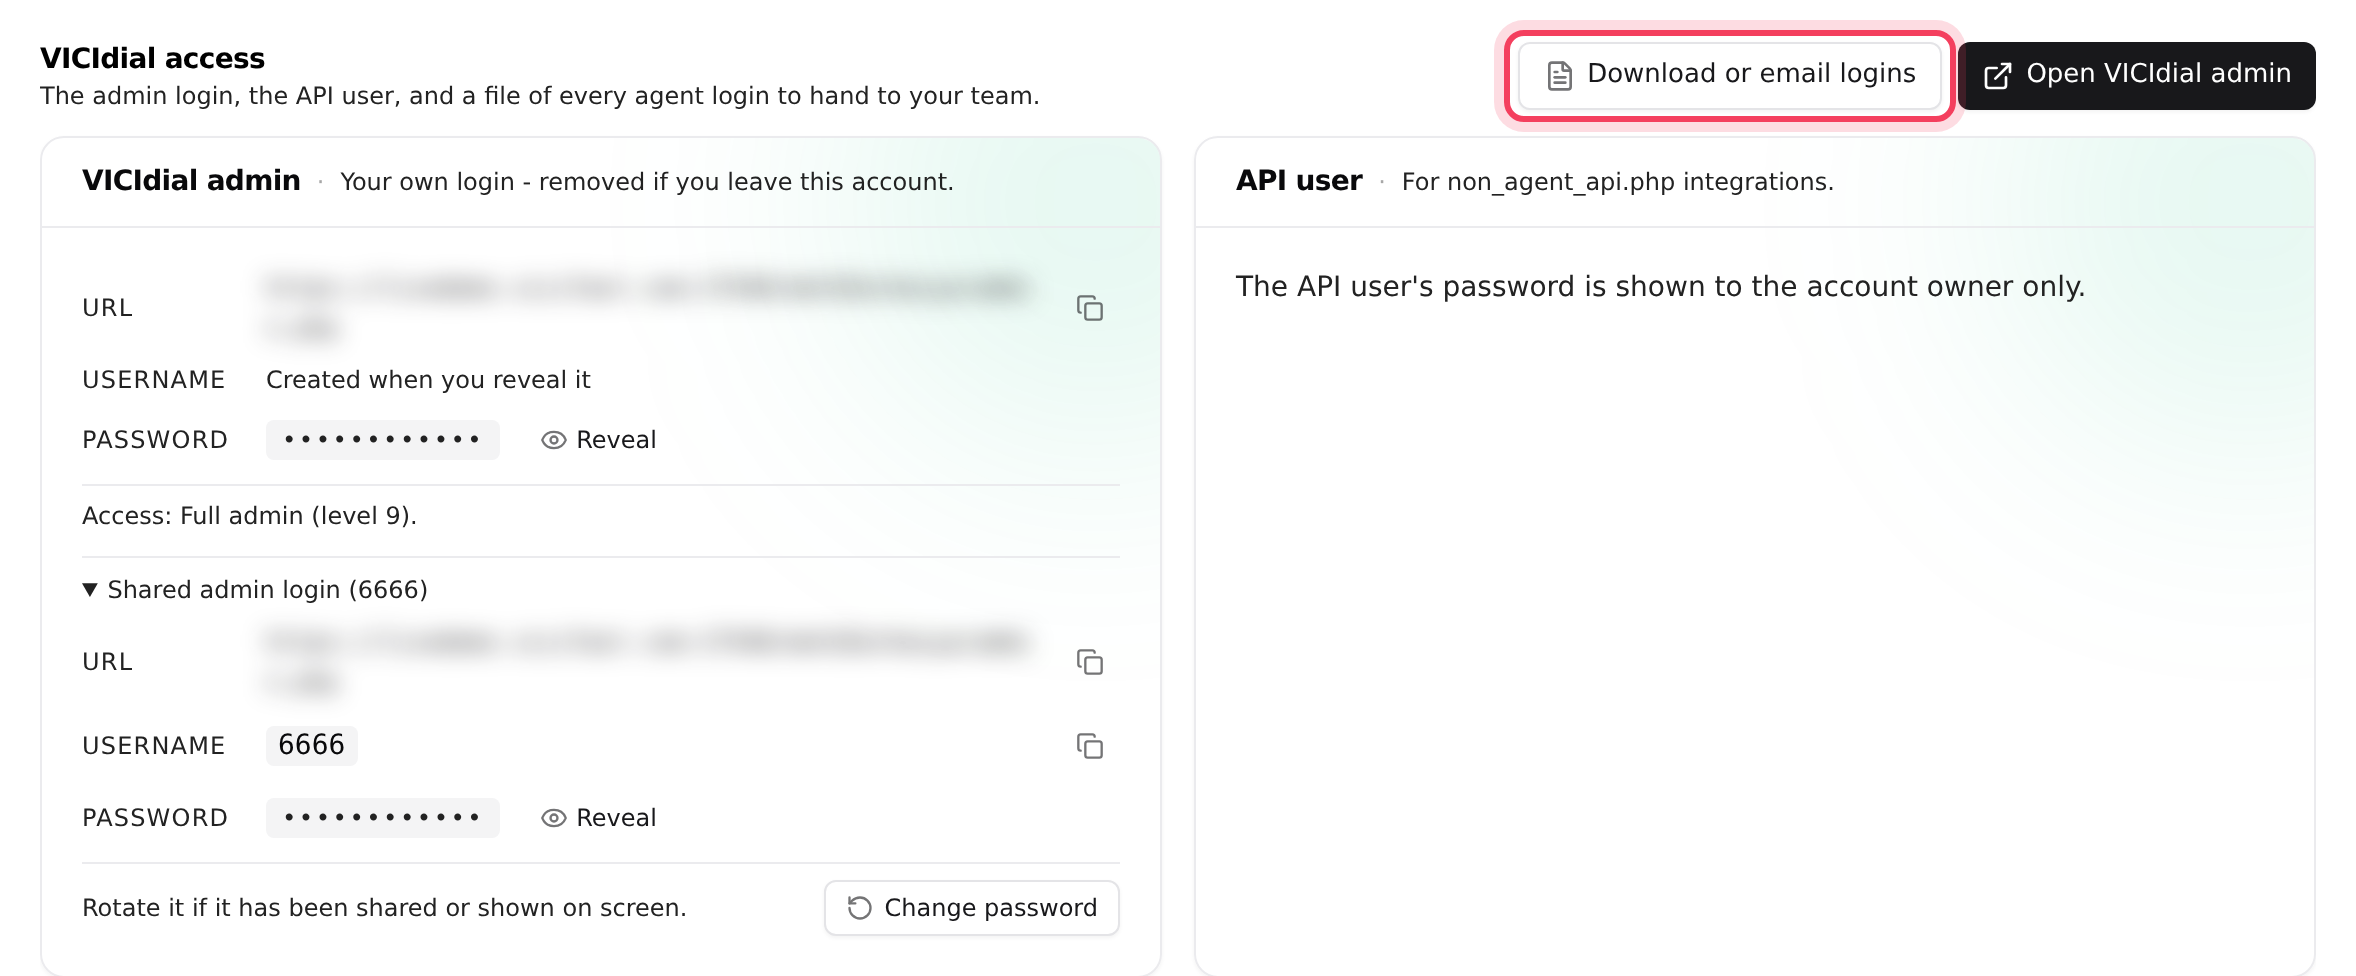
- The VICIdial admin card holds the admin address, the user name 6666 and the password behind Reveal. Change password gives it a new one. Team members see their own VICIdial login here instead, with the shared 6666 login folded away under Shared admin login (6666).
- The API user card is for software that connects to VICIdial, not for people.
- Download or email logins gives you one file with every agent's login to hand to your team.
More in Open VICIdial admin and the agent screen.
The tabs
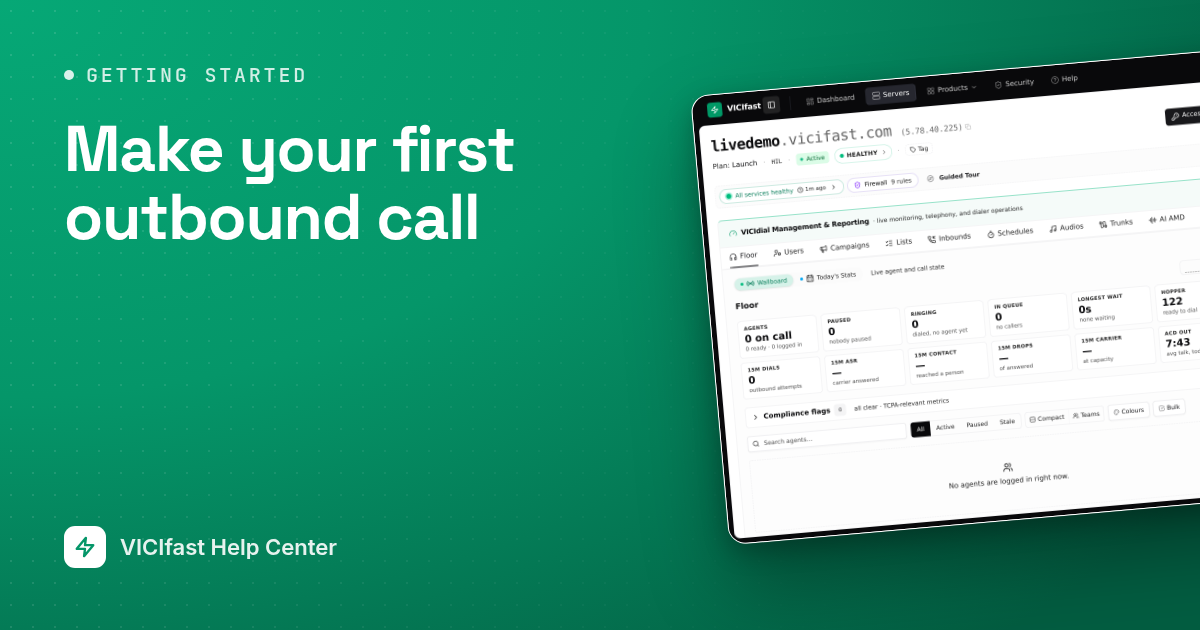
Below sits VICIdial Management & Reporting, where the daily work happens. It always opens on Floor.
- Floor: who is on a call, ready or paused right now (Wallboard), and today's totals (Today's Stats). See Floor.
- Users: agent logins (Users) and User Groups.
- Campaigns: your campaigns, plus Dispositions, Scripts & Filters and Soundboards.
- Lists: your lead Lists, the Leads in them, and past Imports.
- Inbounds: phone numbers (DIDs), queues for incoming calls (In-groups), Call Menus, Filter Phone Groups and CID Groups.
- Schedules: Call Times, Holidays and Shifts.
- Audios: recordings your campaigns play, uploaded or made from text.
- Trunks: your phone lines, with Send test call and backup routes.
- AI AMD: answering-machine detection, on servers where it is offered.
- Mobile app: settings for VICIfast Phone, the free Android app.
- Reports: reports, exports and call recordings.
- Logs: changes made on this server, kept for 7 days.
Shortcuts: press a tab's first-letter key to jump to it, or ? to see every shortcut. The Fullscreen button (Shift + F) fills the screen, handy for a wall display.

Why your page might look different
- Team members only see the buttons and tabs their role allows, so their page can look emptier than the owner's. That is normal.
- While a server is still being built, the page shows the progress card, and each tab says it appears once the server reaches ACTIVE.
- When a cancellation is scheduled, Setup Wizard and Migrate from ViciBox are hidden.
If something goes wrong
Frequently asked
- Both are for the account owner only. Setup Wizard is also hidden while a cancellation is scheduled.
- The server has stopped reporting in. Open Server Health to see the last reading and any alerts. If it stays like this, the server may be down: try Reboot, or chat with support.
- Agent logins exist but no agent has approved their address. Click Access OK (or Agents blocked), copy Your agent link and send it to your agents.
- That feature isn't in your plan. Clicking it opens the pricing page. See Change your plan or add-ons.
- The server is still being built or isn't running. Wait for the status to read Active.
- That campaign's calls have no working phone line to go out through. Fix the line on the Trunks tab, or pick a working trunk from the banner. See My campaign isn't dialing.