Reports and agent stats
Check today on Today's Stats, read any report on the Reports tab, see each agent's numbers, and download or email reports on a schedule.
Floor, recordings & reports · 4 min read
Two places answer "how are we doing?". Today's Stats, on the Floor tab, shows today since midnight. The Reports tab covers any period, per agent, campaign or queue. Every report can be downloaded or emailed on a schedule.
What you need
- A server with some calls on it. A new server shows zeros until agents start calling.
- If you are a team member, the Floor tab (for Today's Stats) and the Reports tab.
Step 1: Check today on Today's Stats
- Click My Servers, then your server's name.
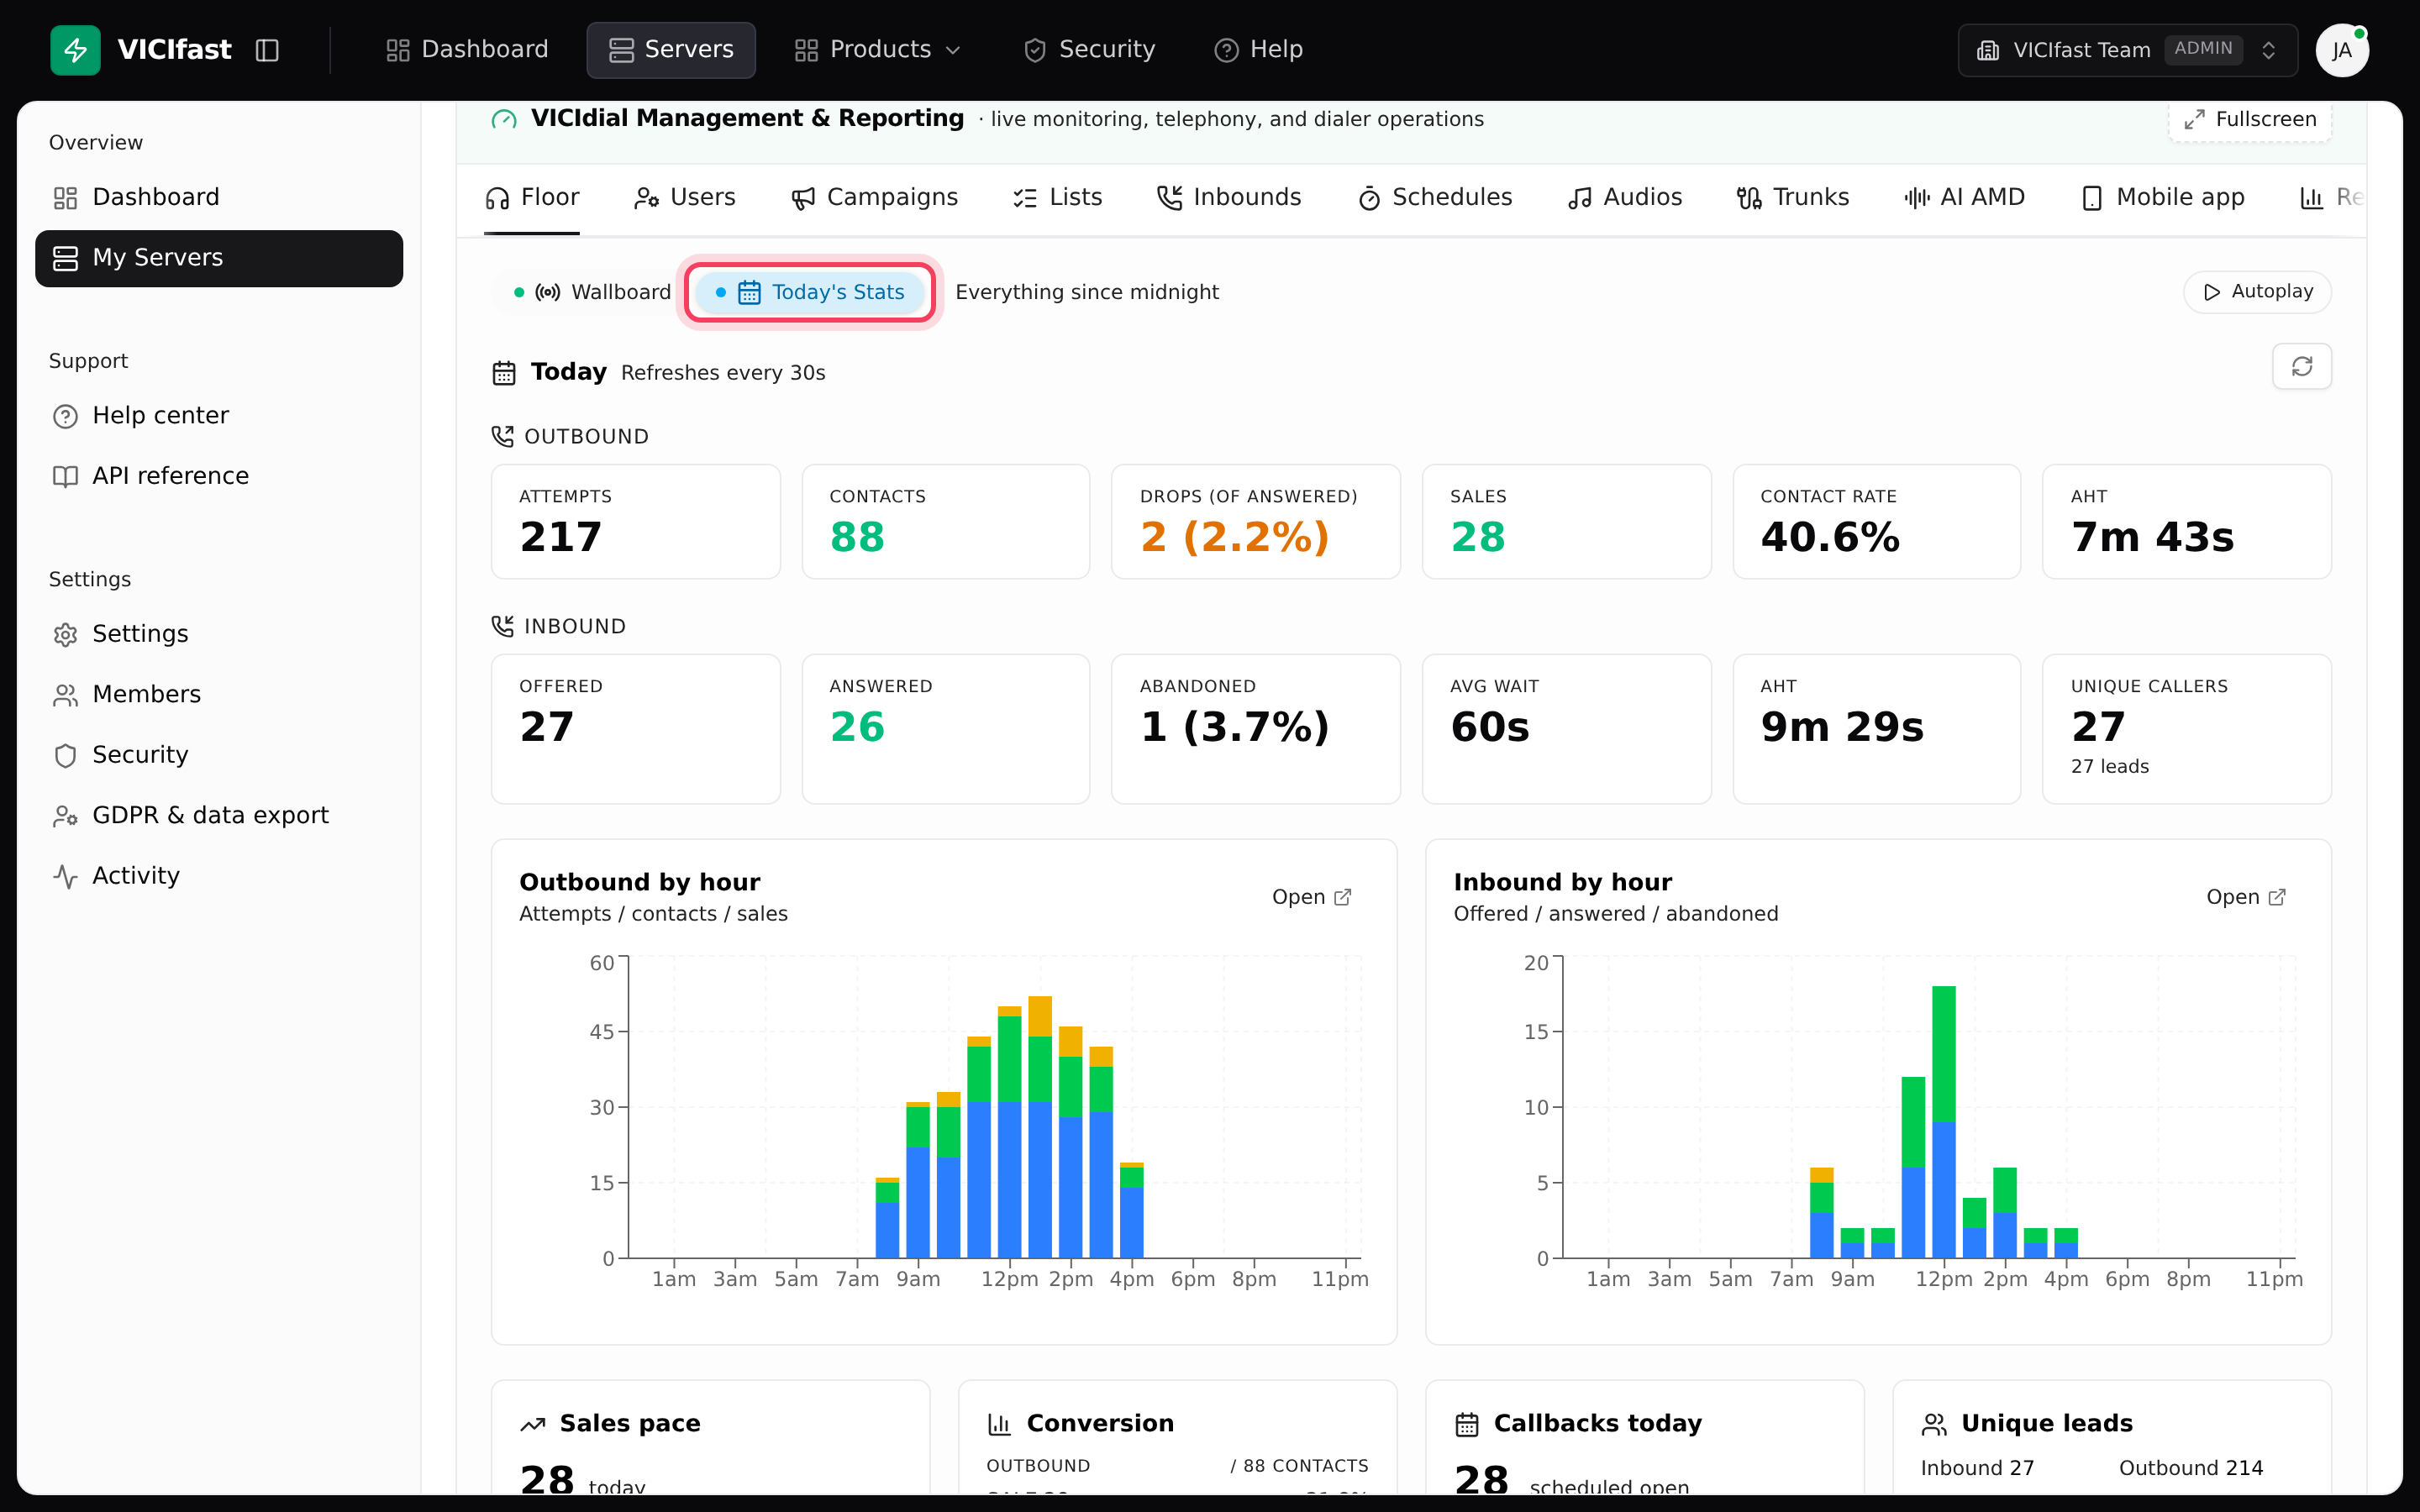
- On the Floor tab, click the Today's Stats chip.
From top to bottom you get:
- Outbound: Attempts, Contacts, Drops (of answered), Sales, Contact rate and AHT (average handle time). Inbound: Offered, Answered, Abandoned, Avg wait, AHT and Unique callers.
- Outbound by hour and Inbound by hour charts.
- Sales pace (compared with the same day last week and your 7-day average, with a projected end-of-day number), Conversion, Callbacks today (with any missed ones in red) and Unique leads.
- Top agents, Top campaigns and Top in-groups (your inbound queues), then a Detail strip: Outbound dispositions, Inbound dispositions, Top DIDs (your busiest phone numbers), By team and Conversion by hour.
It refreshes every 30 seconds. "Today" starts at midnight in your server's time zone. Click Open on a card to see the full report behind it.
Step 2: Open the Reports tab
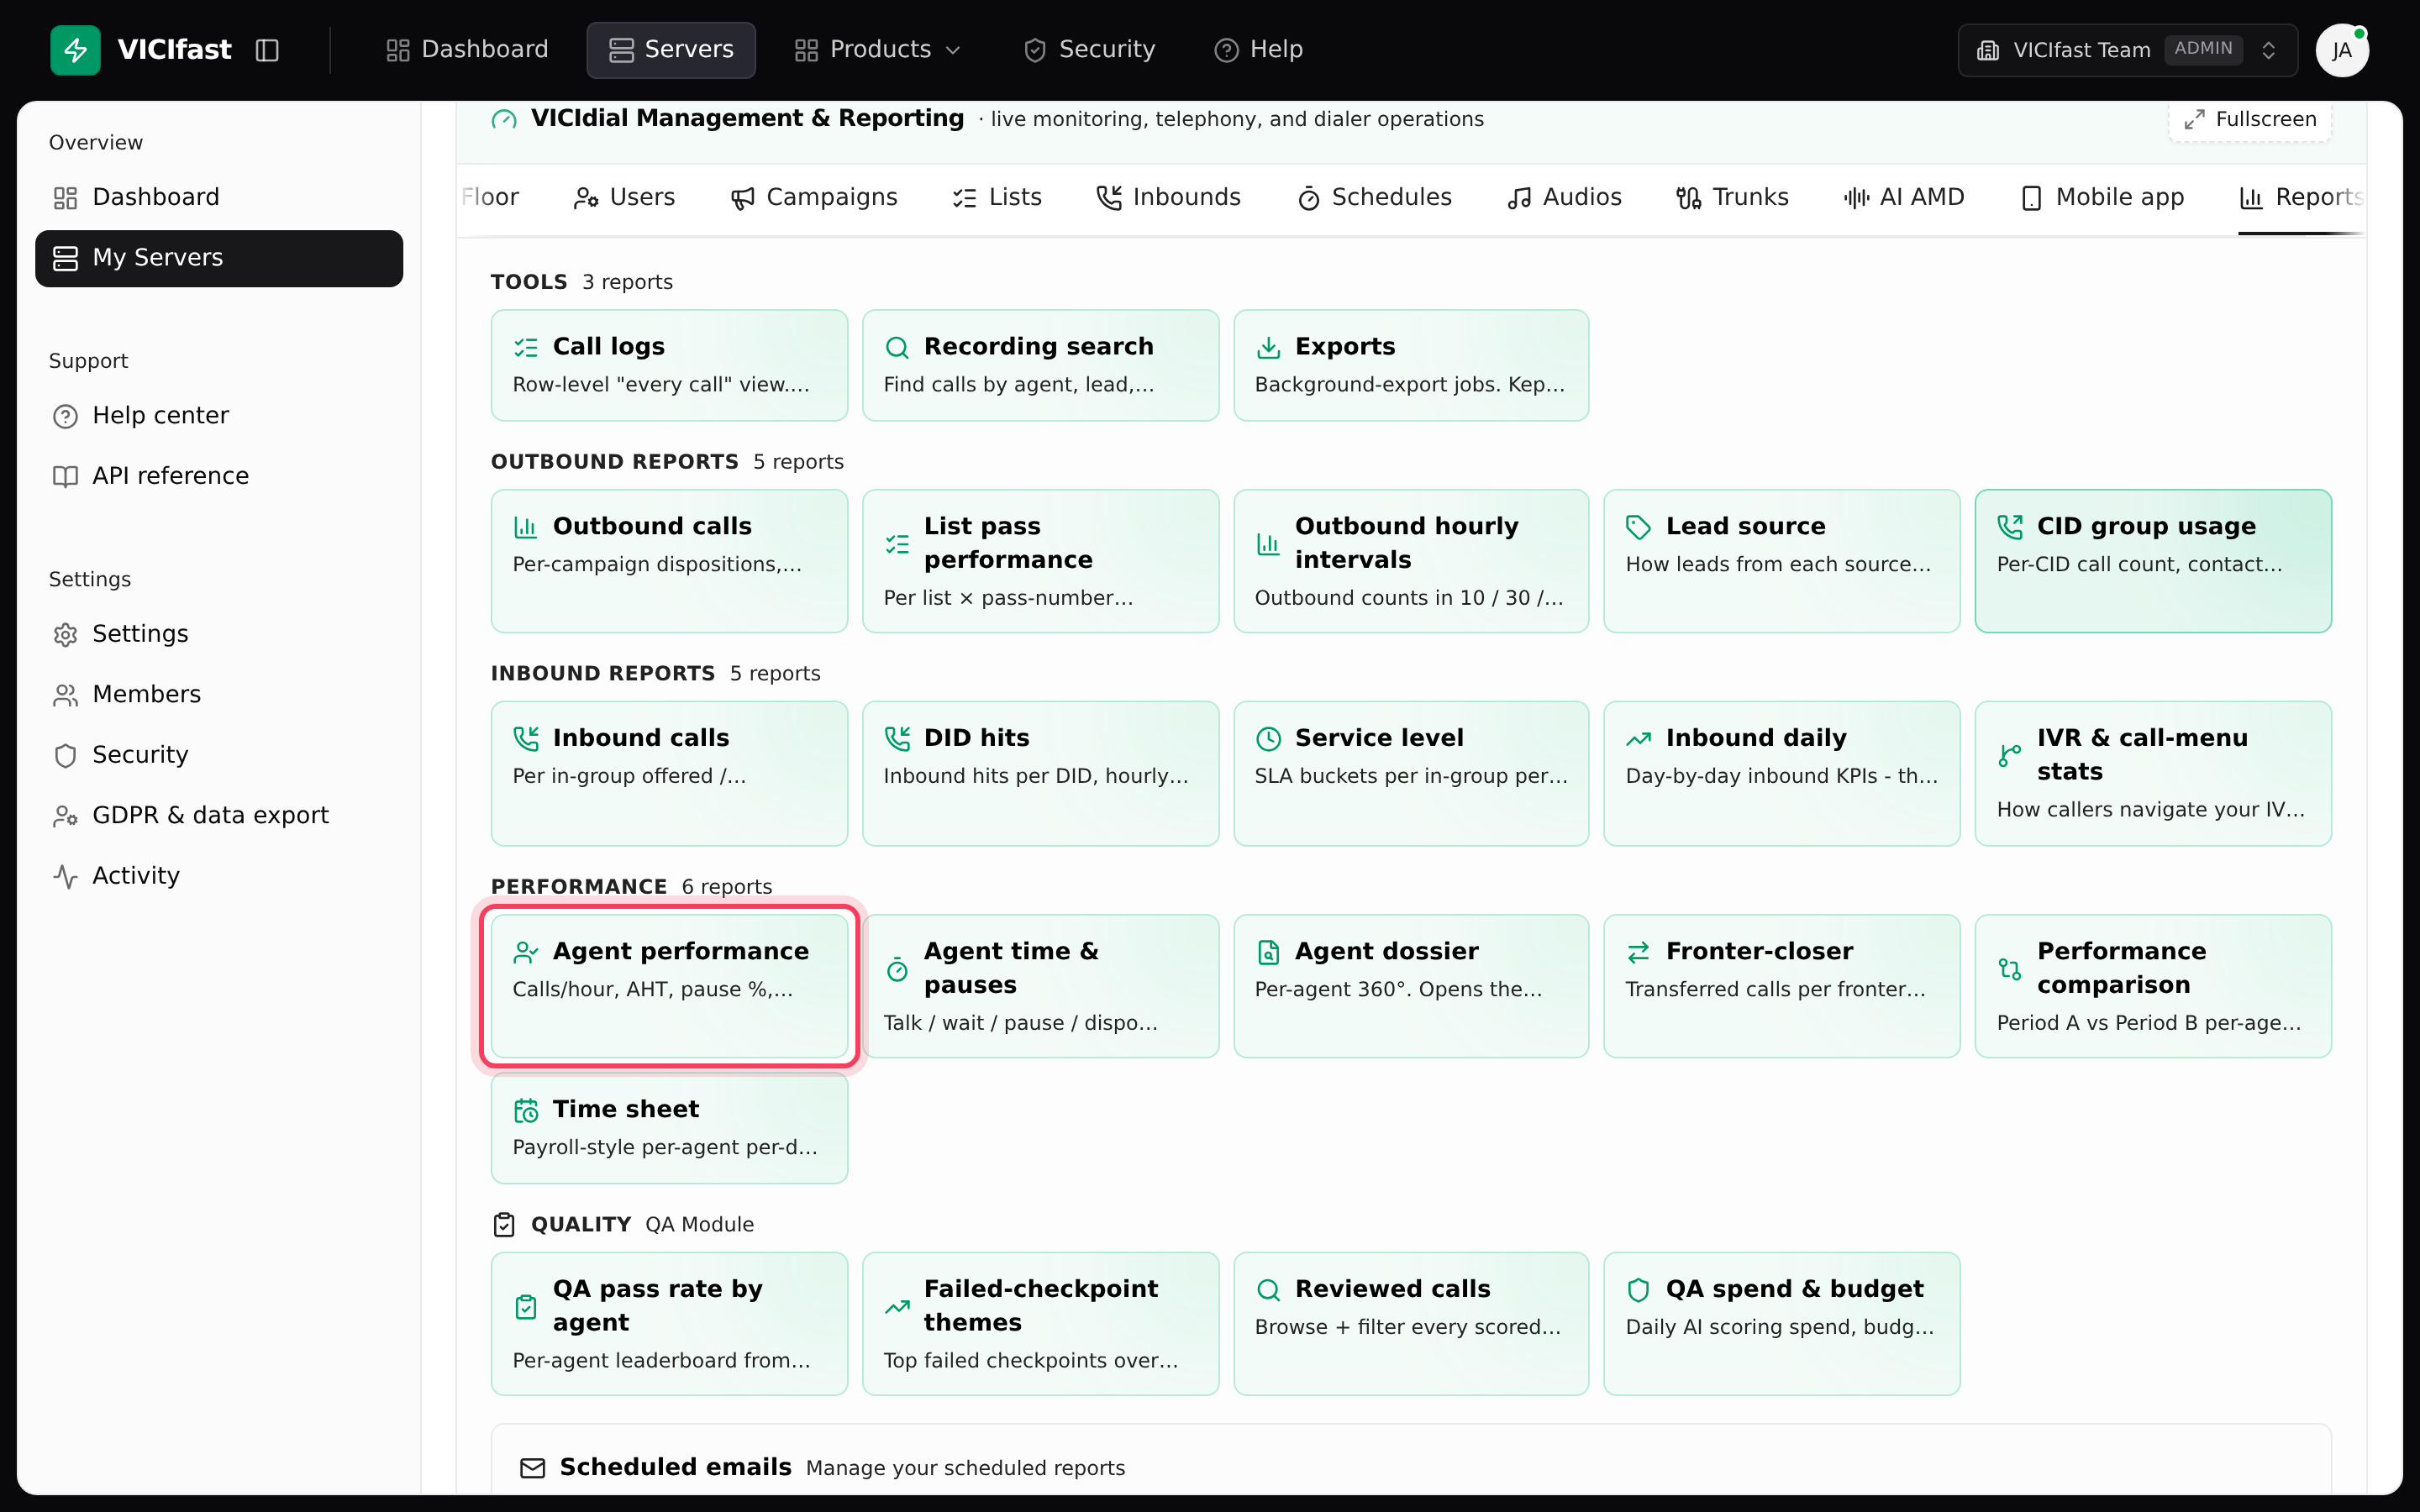
- Click the Reports tab, or press r.
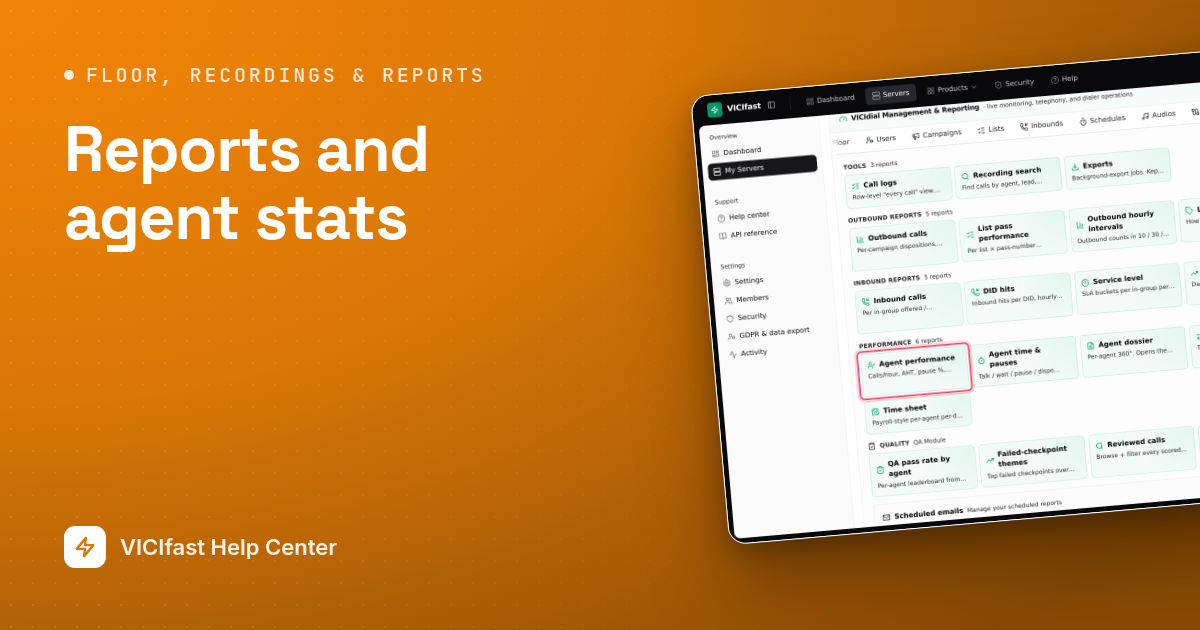
- Find the report you need. Reports are grouped as Tools (Call logs, Recording search, Exports), Outbound Reports, Inbound Reports, Performance and Quality.
If something looks wrong compared with your last 7 days, a Hot spots - investigate box appears at the top. Click Open report → to go straight to the report behind it.
Step 3: Read a report
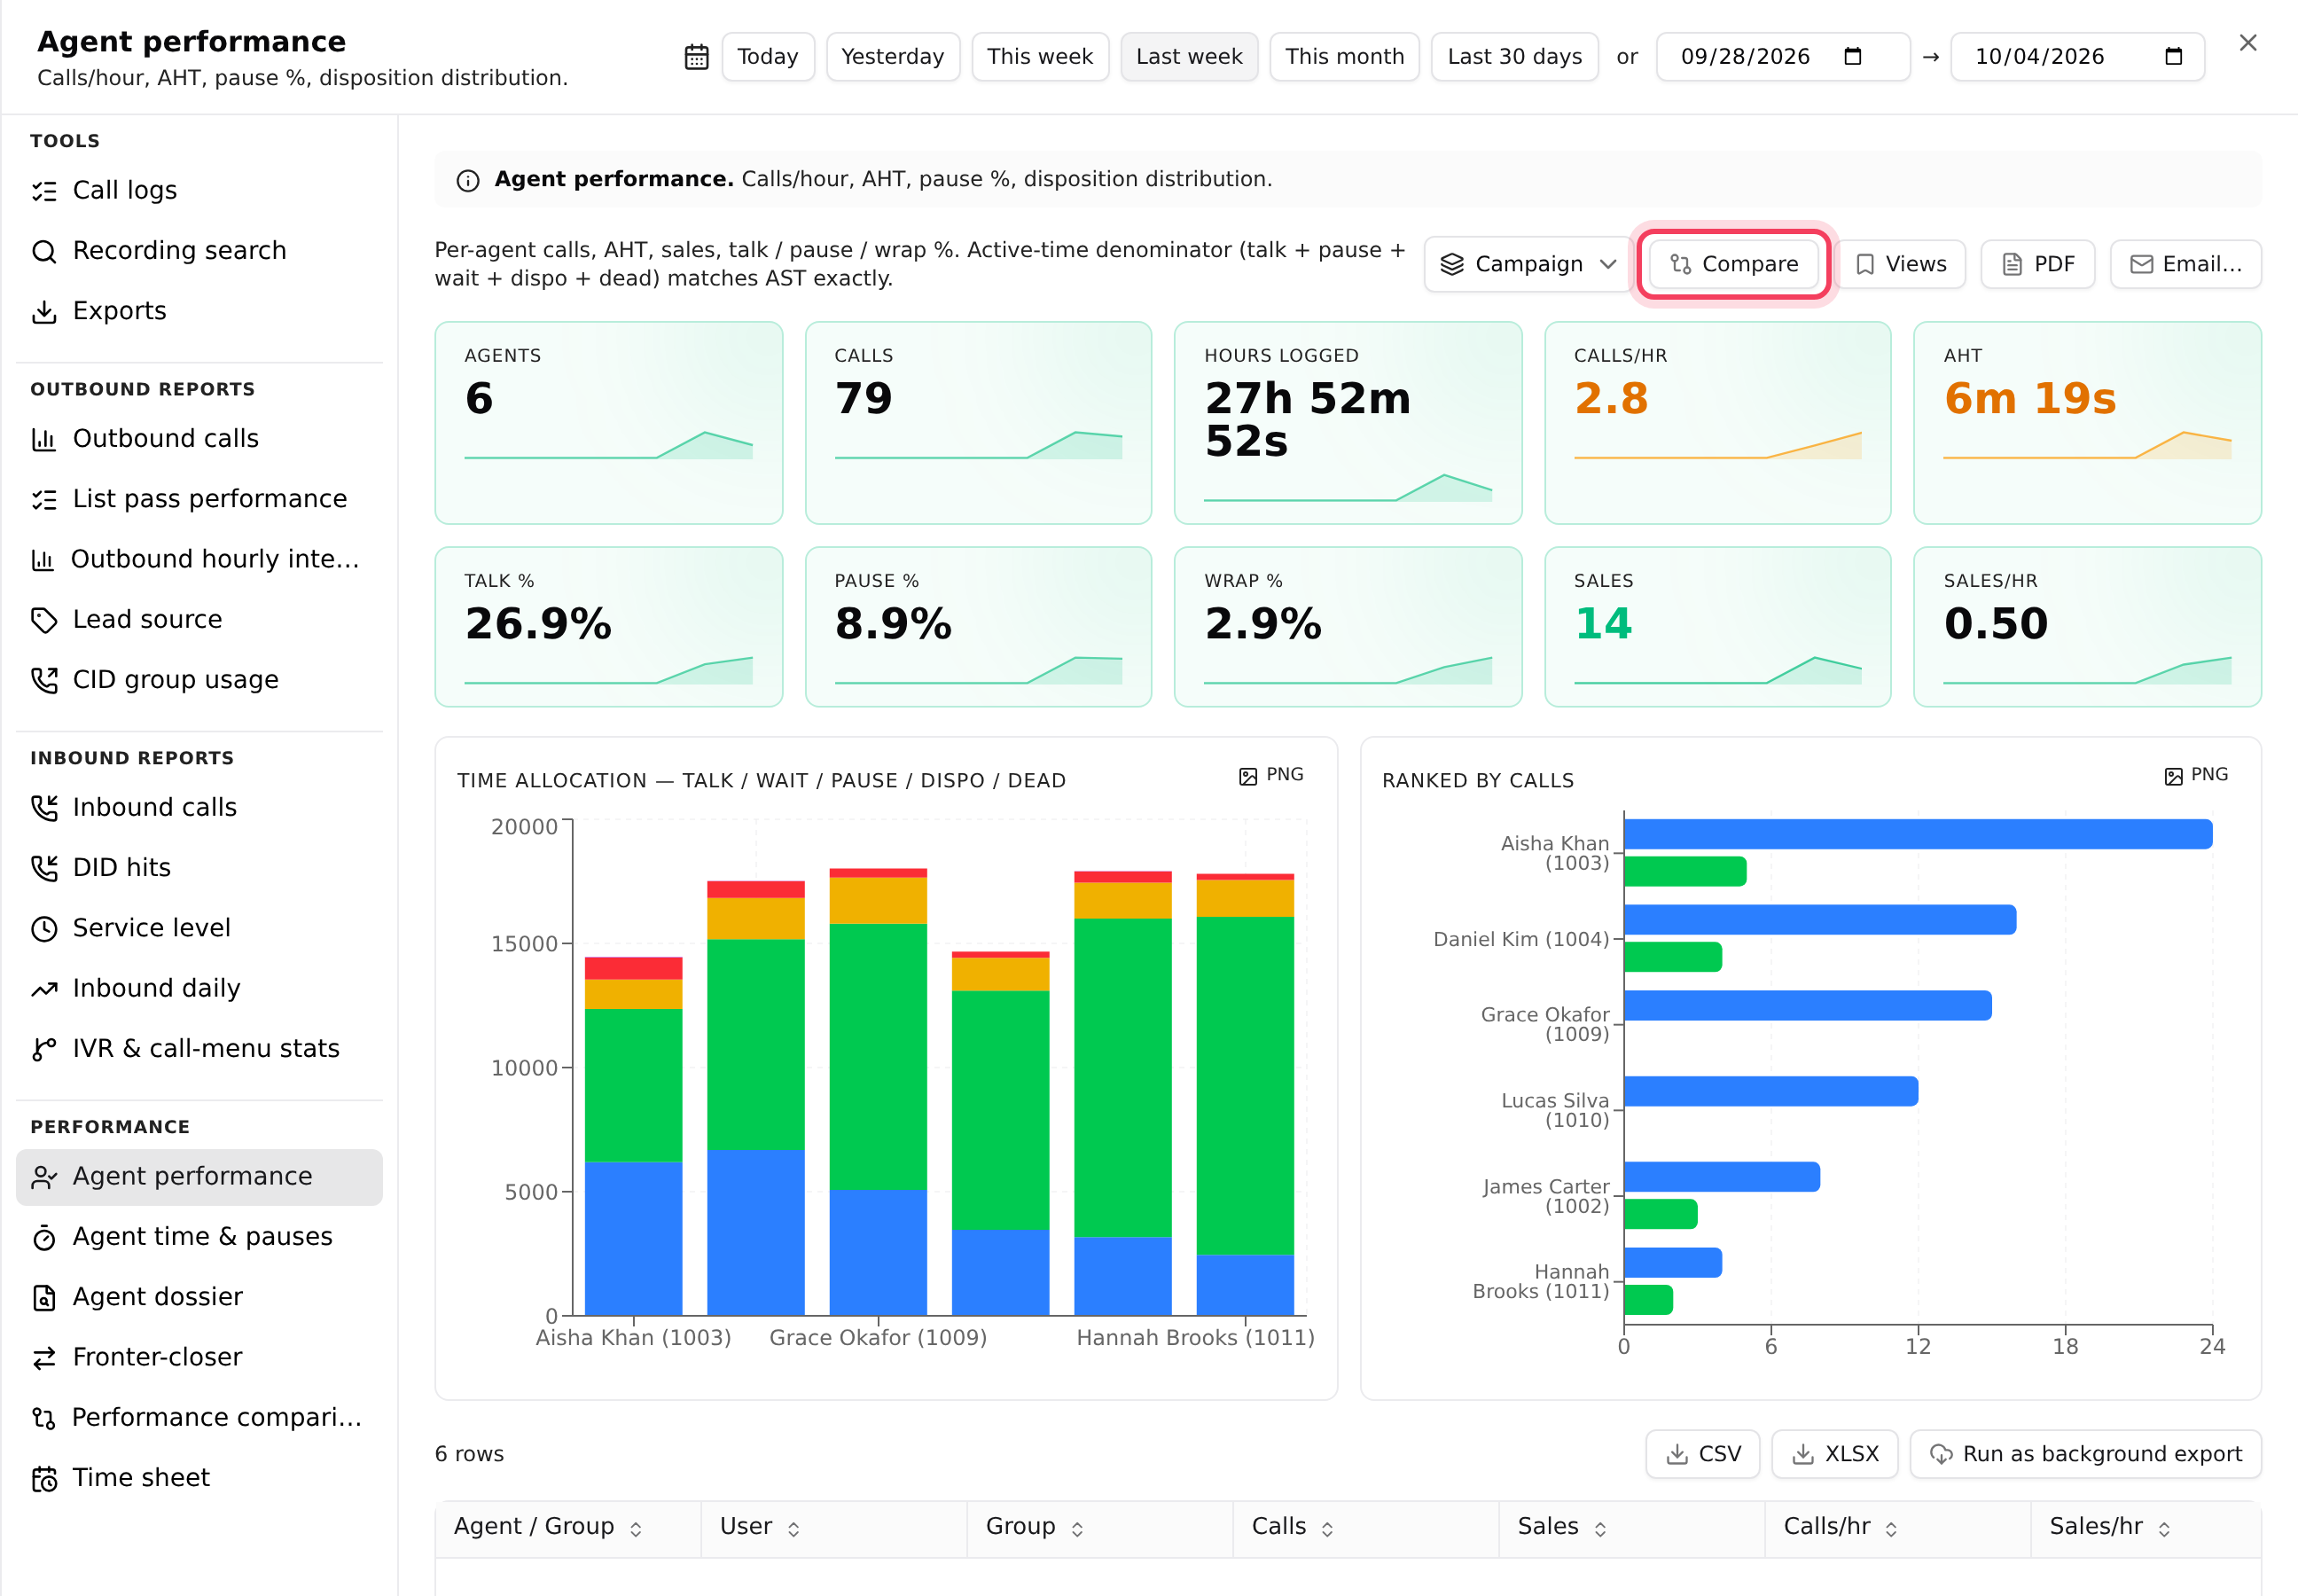
- Click a report card. It opens in a panel on the right, with every report listed on the left so you can hop between them.
- Pick a period: Today, Yesterday, This week, Last week, This month, Last 30 days, or two dates.
- Where offered, use the group-by menu to change the cut, for example by Agent, User group, Campaign, Day or Pause code.
- Click Compare to set each headline number against the previous period of the same length.
- Click Views to save the period and filters under a name, so next week's check is one click.
- Click a column heading to sort. Click the arrow on a row to expand it.
Step 4: See how each agent is doing
- Agent performance shows one row per agent with calls, calls per hour, AHT, sales, and Talk %, Pause % and Wrap %. These are shares of the agent's active time, the same way VICIdial's own reports count them.
- Agent time & pauses shows talk, wait, pause and wrap-up time, split by pause code.
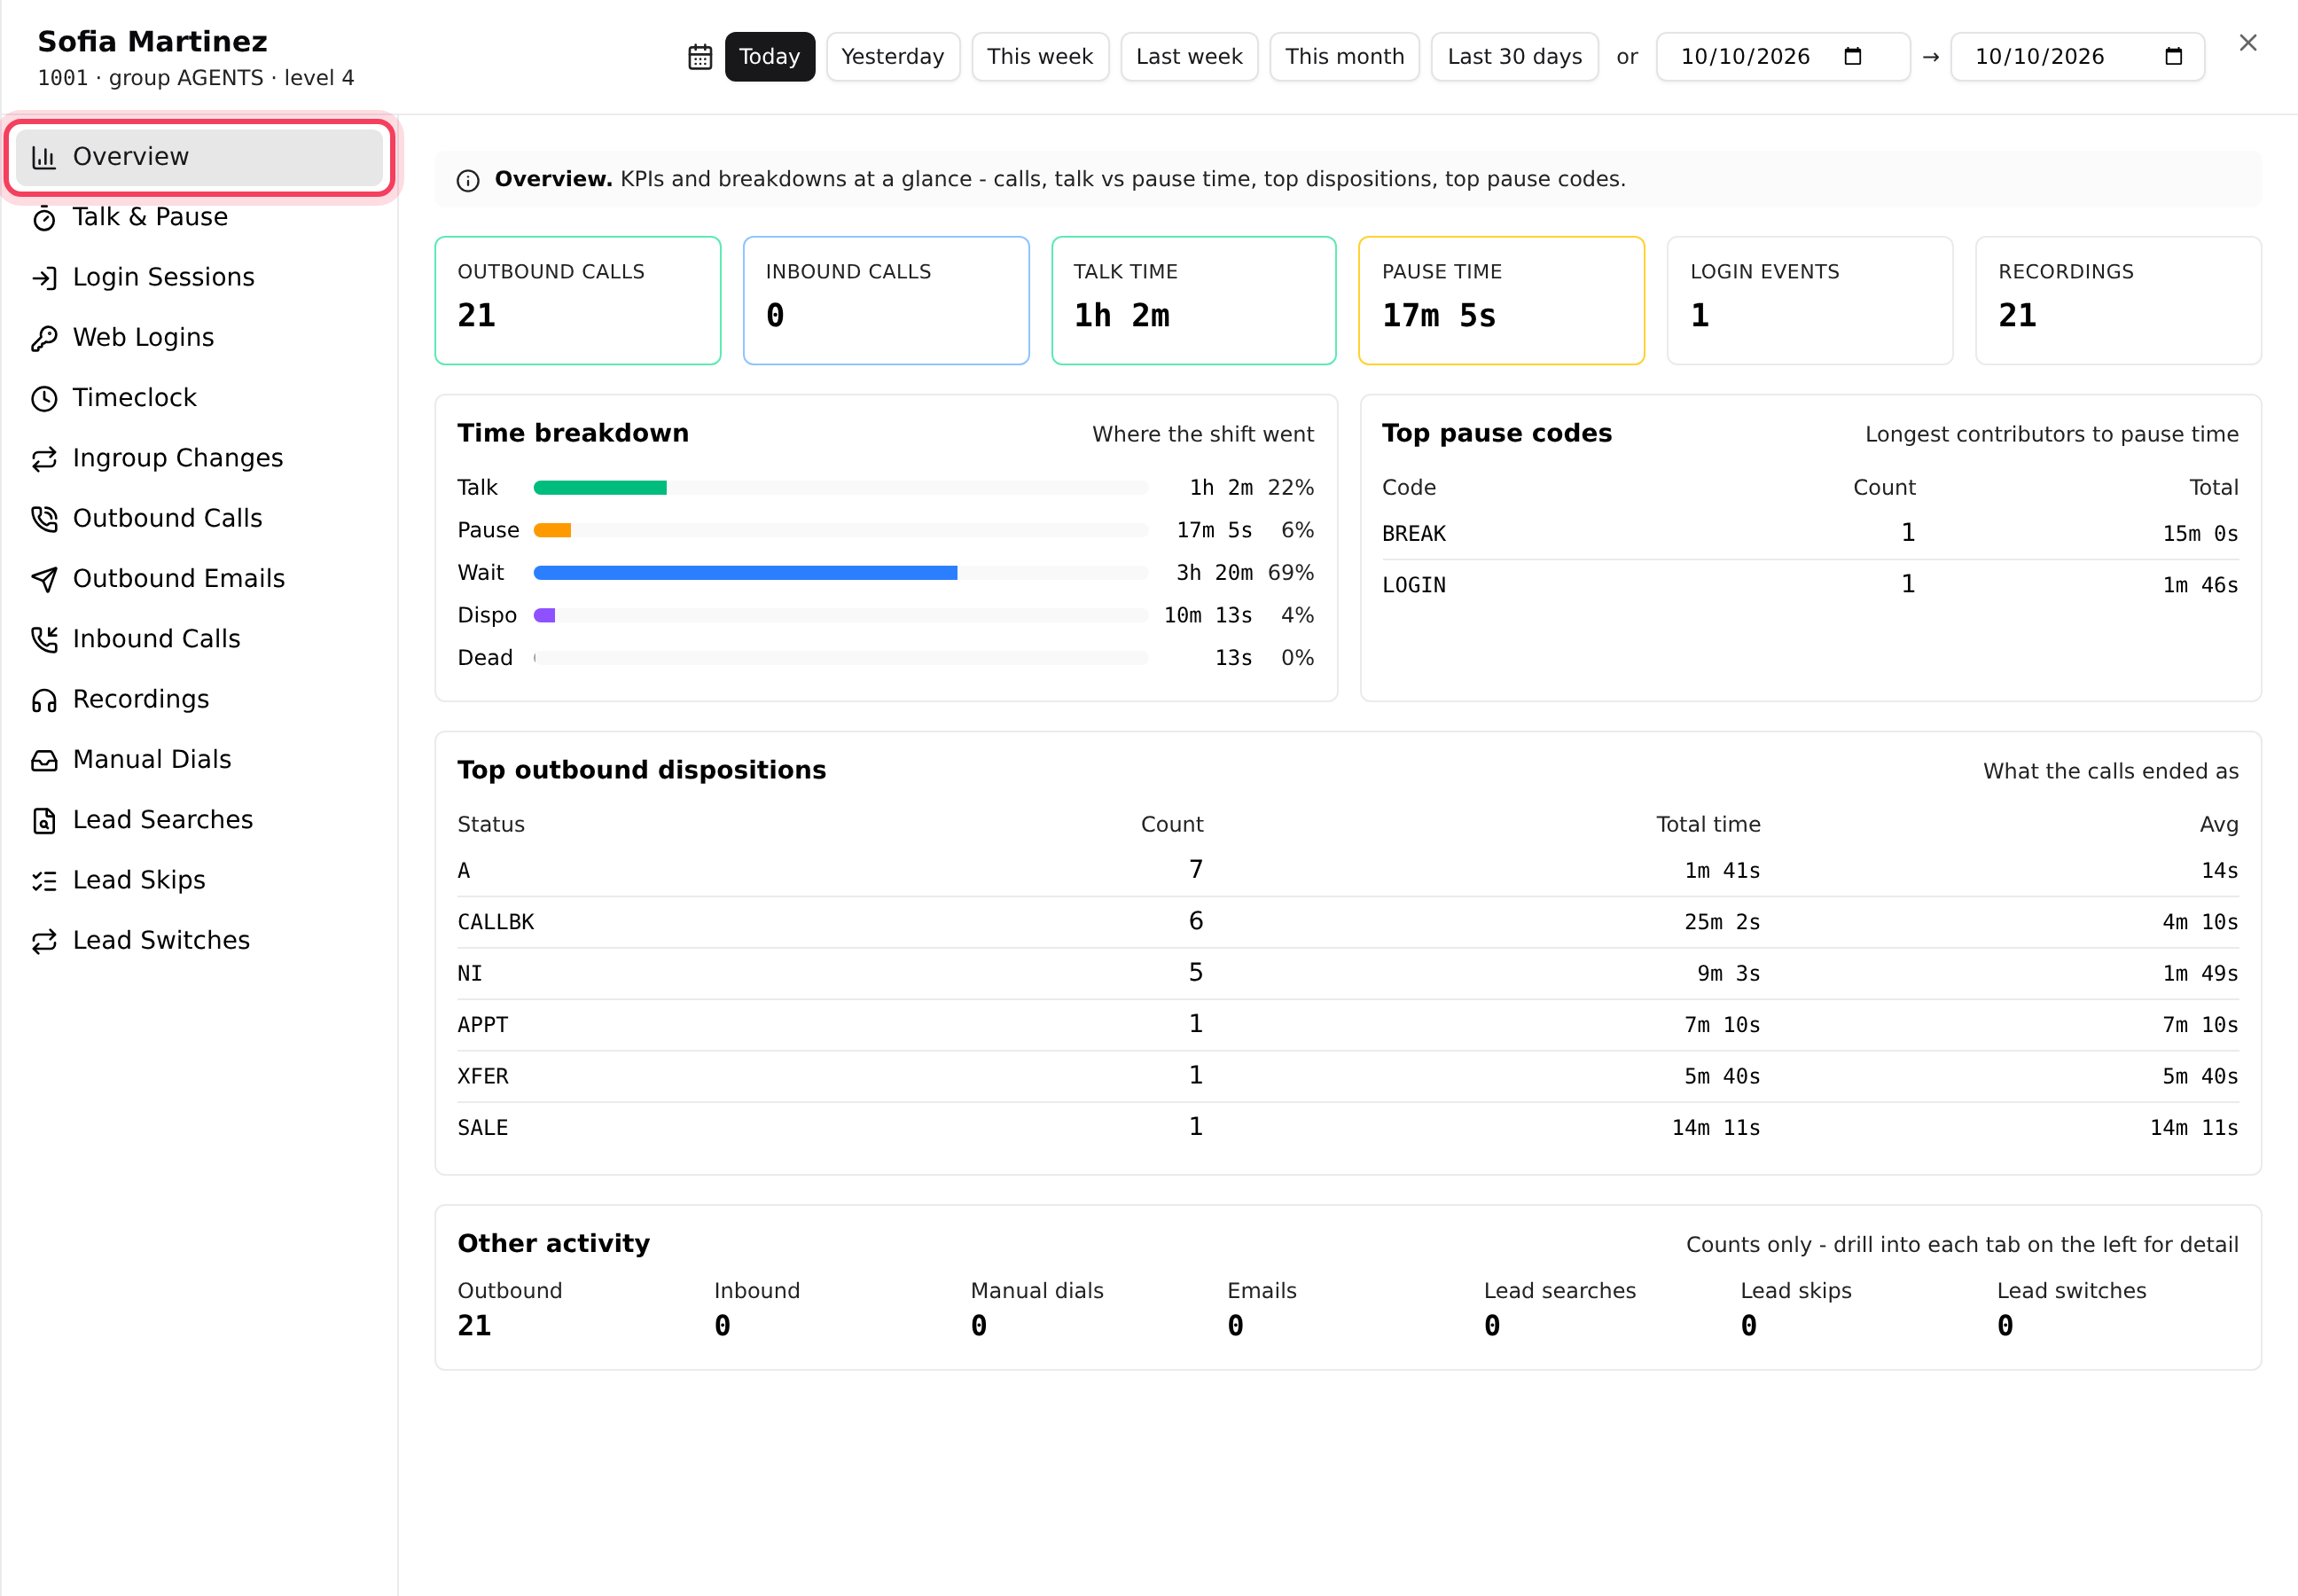
- For one agent's full story, click their username or name on the Users tab. The agent's page has 14 tabs, including Overview, Talk & Pause, Login Sessions, Timeclock, Recordings and Manual Dials. The period at the top applies to all of them.
Step 5: See one campaign's numbers
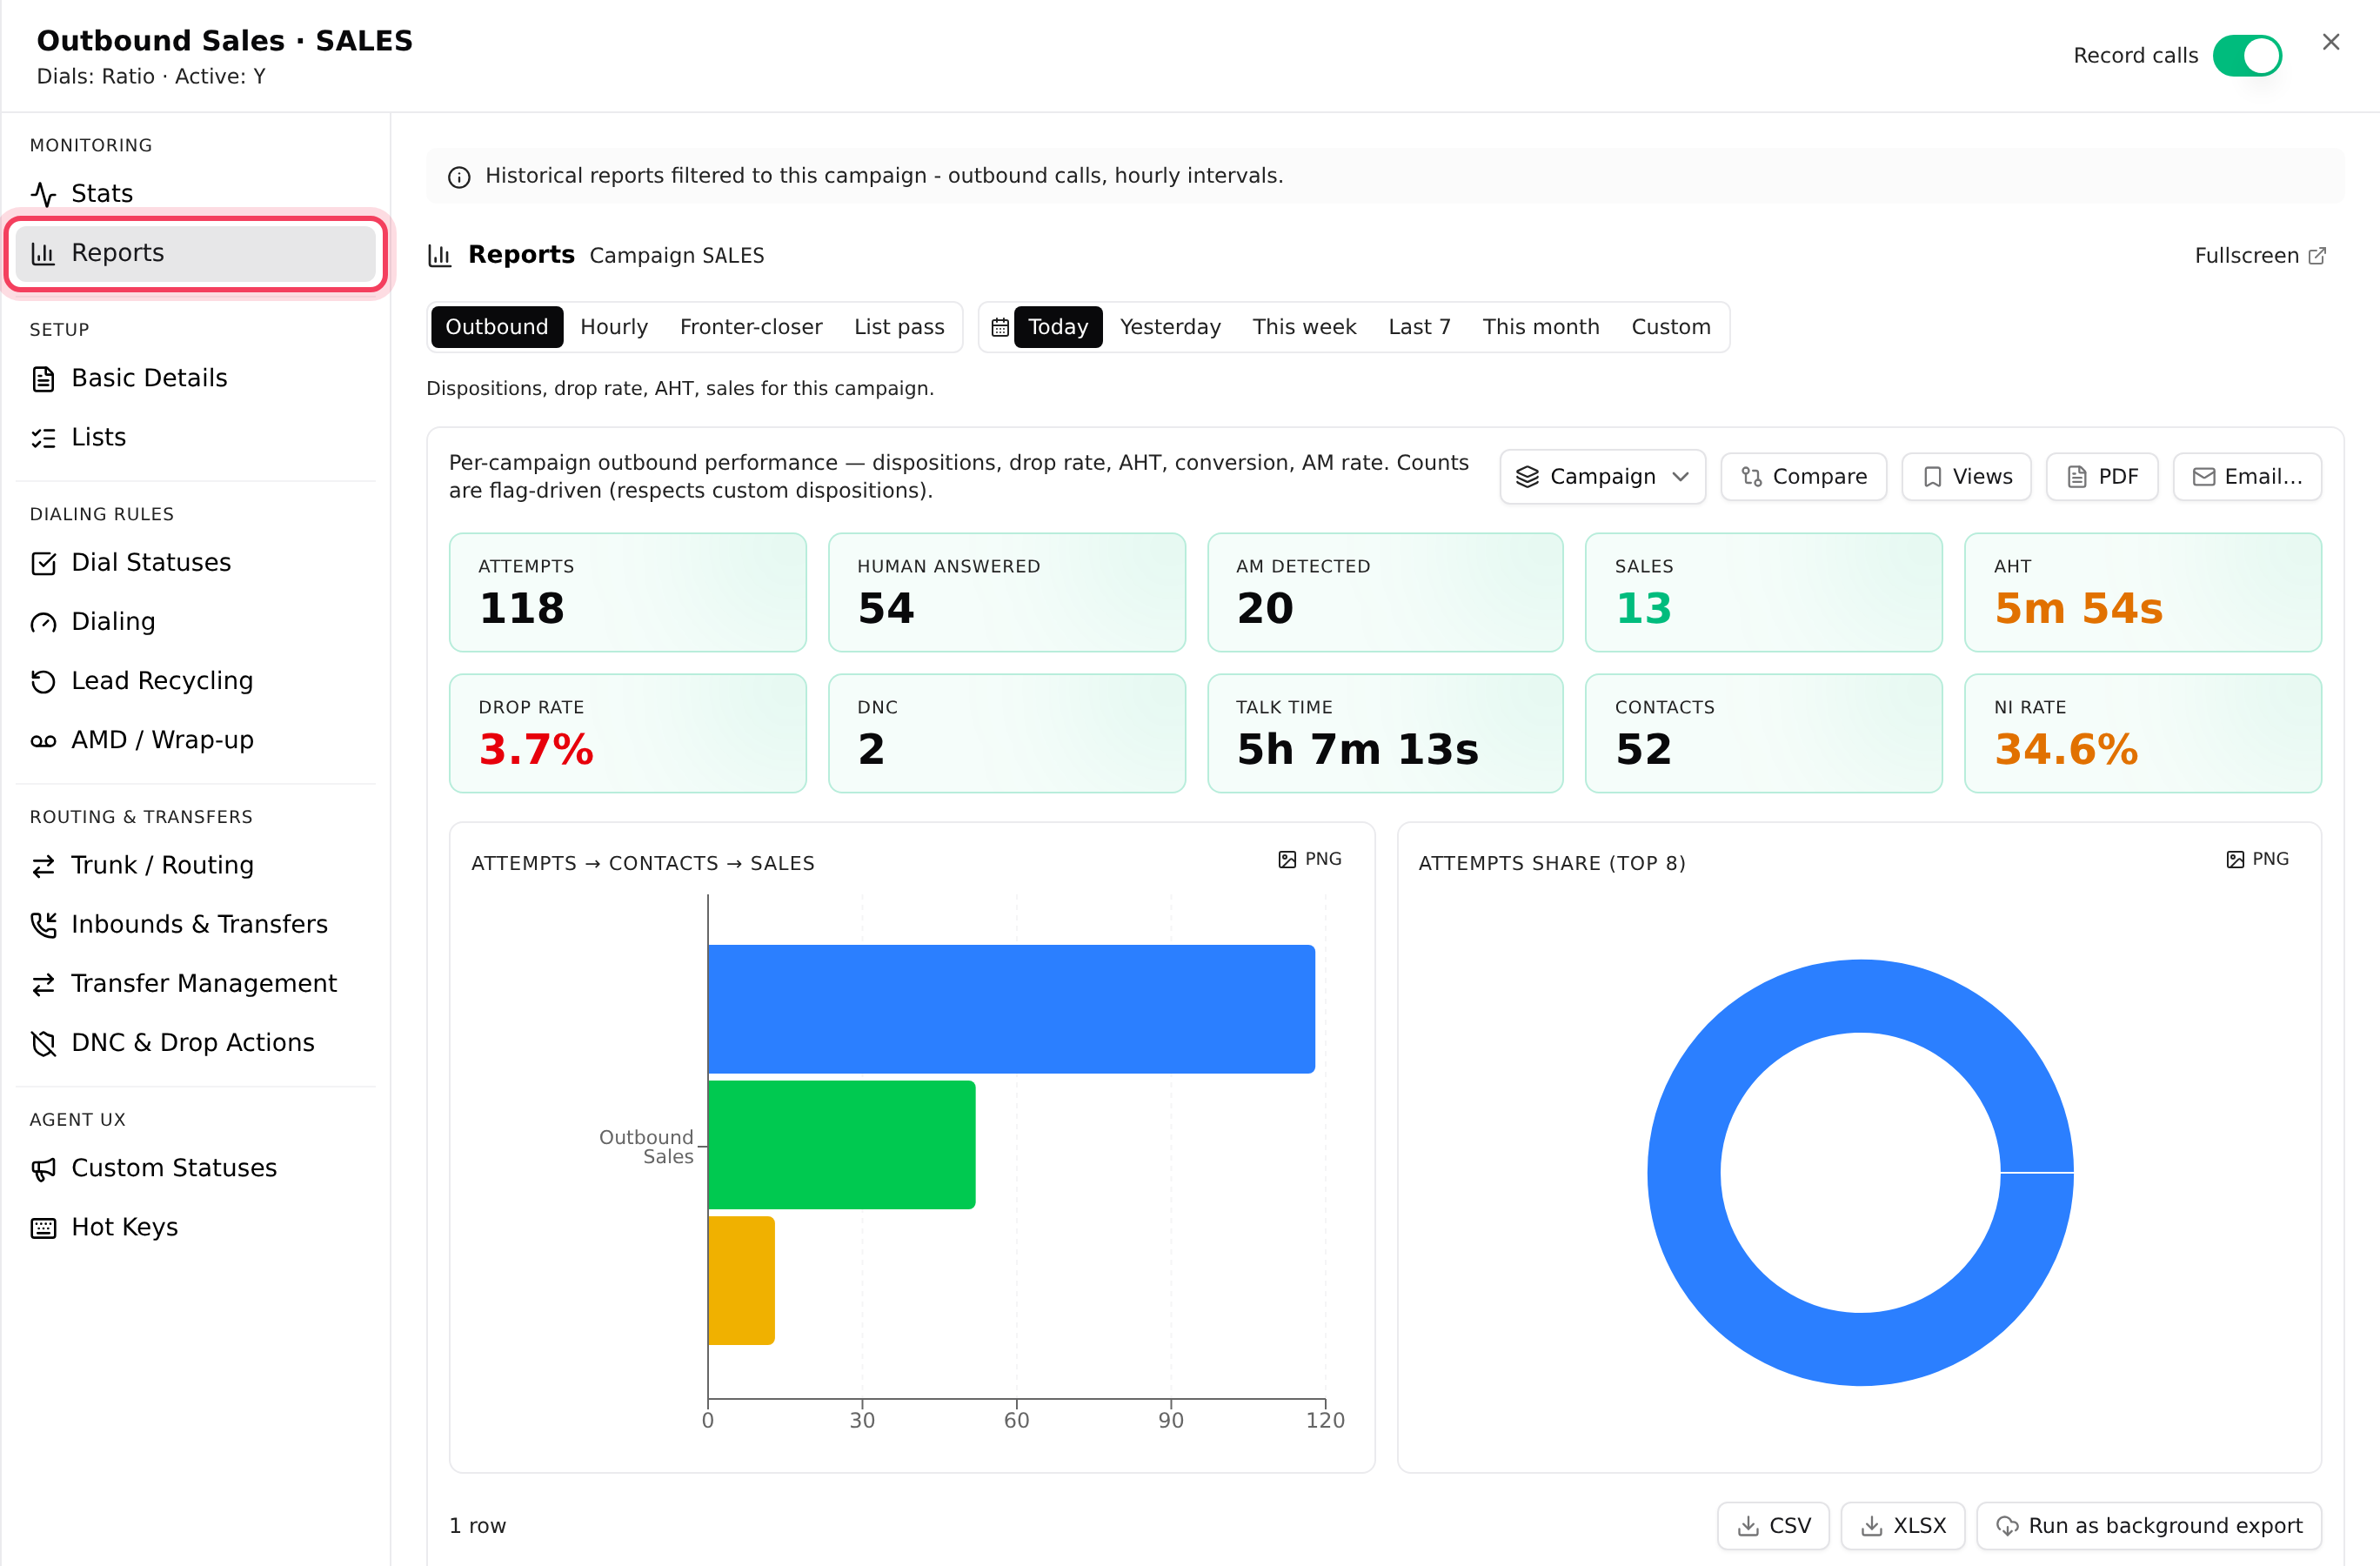
- Click the Campaigns tab, then the campaign's name, for example Outbound Sales.
- In the list on the left, click Stats for a live view that refreshes every 30 seconds, including a Live (last minute) section.
- Click Reports in the same list for four reports already filtered to this campaign: Outbound, Hourly, Fronter-closer and List pass.
Step 6: Download, export or email a report
- CSV and XLSX download the rows you see, in the same order. PDF opens a print-friendly page; use your browser's Save as PDF. Charts have their own PNG button.
- Run as background export is for big reports such as a month of Call logs. We email you a link when it is ready. Exports stay under Tools, Exports for 7 days, where you can download, re-run or delete them.
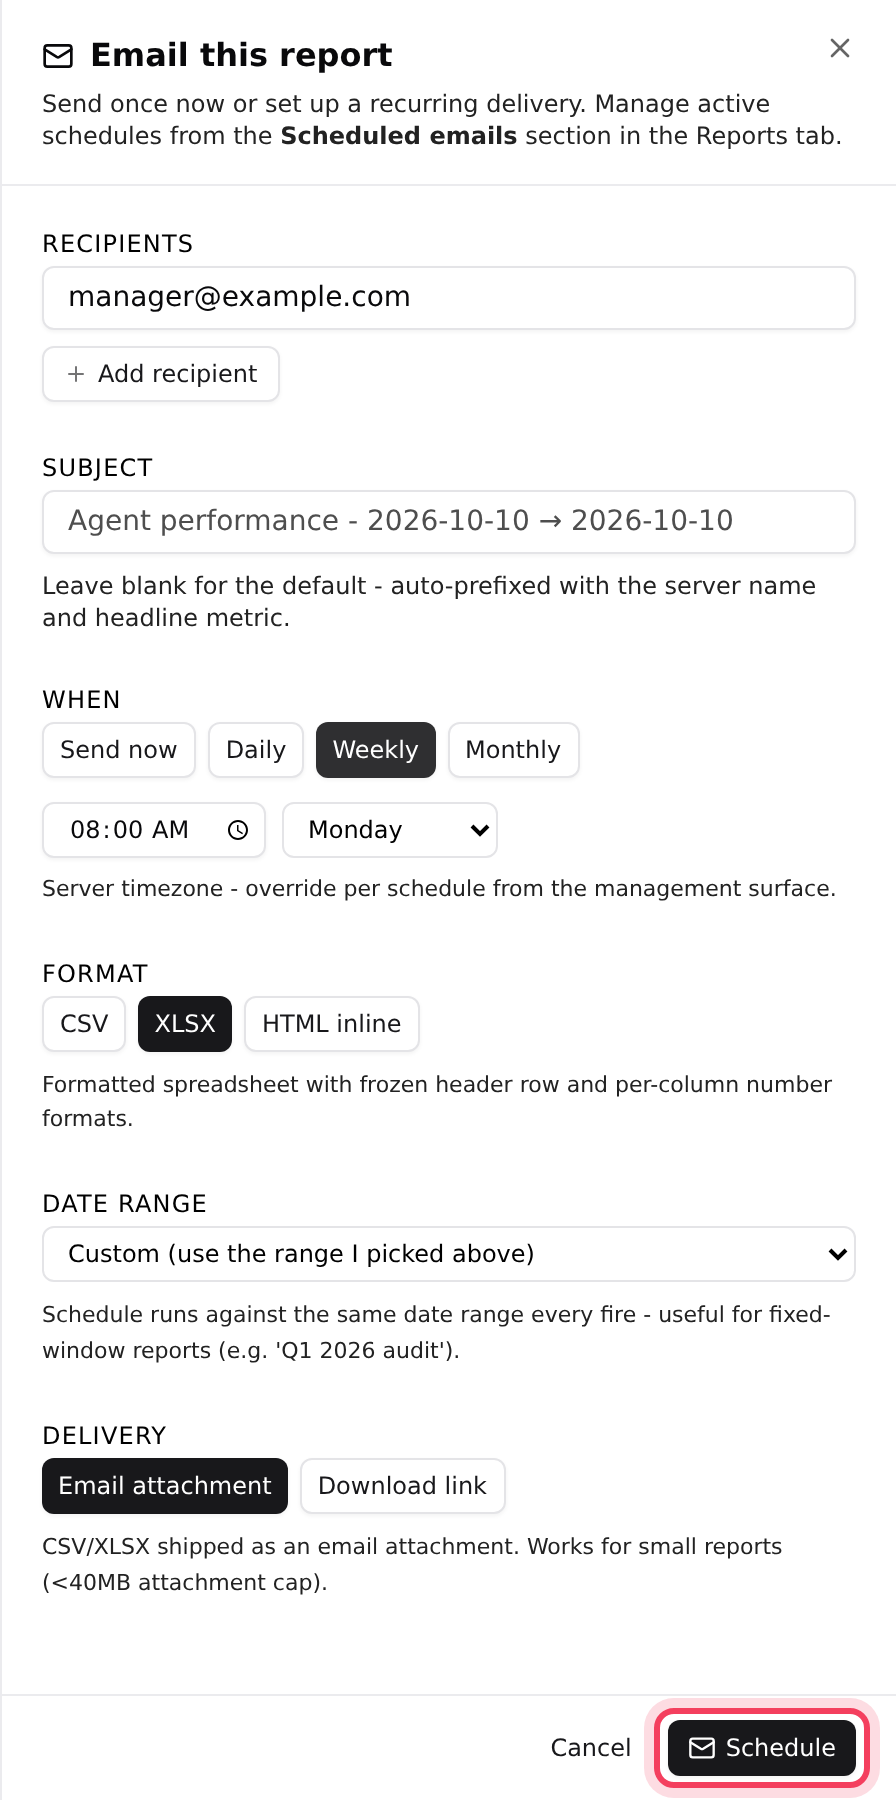
- Email… sends the report now or on a schedule. Add Recipients, pick When (Send now, Daily, Weekly or Monthly) and a Format (CSV, XLSX or HTML inline), then click Send now or Schedule.
Schedules appear under Scheduled emails at the bottom of the Reports tab, where you can run, pause or delete them.
If something goes wrong
Frequently asked
- No calls have been made in the period yet. On a new server, numbers fill in as soon as agents start calling.
- Today's Stats and reports use your server's time zone, not your computer's. See Change your server's time zone.
- Pick a longer period or clear filters.
- On-screen tables are capped. Use Run as background export for the full set.
- Download link delivery goes to the person who set up the schedule. Choose Email attachment to send to every recipient, or share the link yourself.
- Exports and their links expire after 7 days. Open Exports and re-run it.